
Fangame Analysis Part 3:
The Results
“The numbers have no way of speaking for themselves. We speak for them.” – Stephen Few
Following on from the overview of the data and method of extraction from Part 1 and the process of data cleaning from Part 2, we can now dive into the results of the analysis itself.
The full analysis is contained in a report which was widely shared in the fangame community [1]. Because it’s rather long and many of the insights are only meaningful to those familiar with the games, for this blog post I’ll present an abridged version focussing on just the most interesting and accessible results.

Fangame Quality and Difficulty
All games submitted to the website have a quality and difficulty (qualdif) rating which is the average of all reviews given. I chose to represent this distribution of ratings as a KDE plot, with both variables mapped over one another to allow for direct comparison.
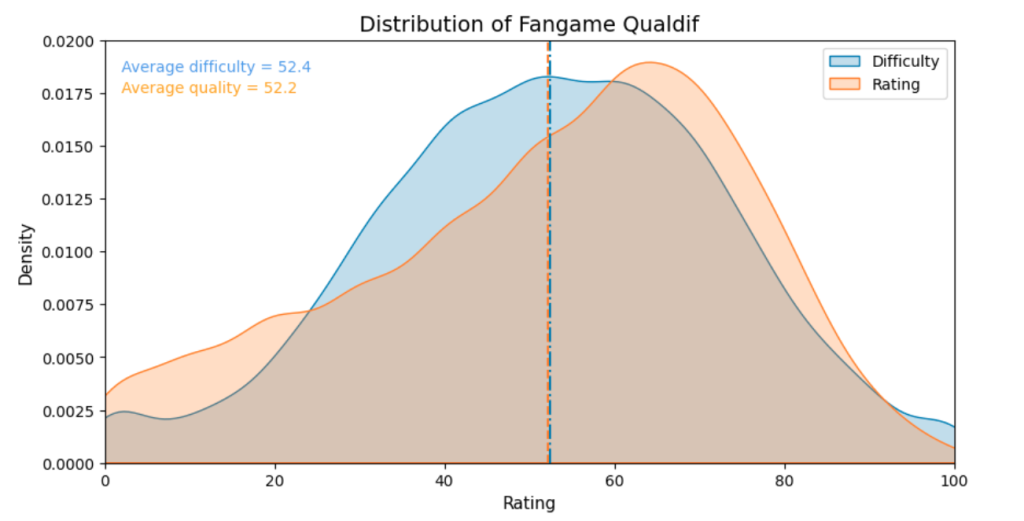
We can see that difficulty appears as a bell-shaped curve approximately centred around 50, with a tail that’s slightly longer on the left than the right. It’s interesting to note that there is a very slight bump close to a difficulty of zero, which might indicate a small subset of joke or nonsense games that get a low difficulty score.
The rating variable by contrast is left-skewed but with a very bulky tail between 0-20, which indicates that though the “typical” fangame is on the whole slightly better than not, there is a sizeable number of very bad games (<20) and only a small number of very good games (>90).
A follow on question from this is: what is the relationship between difficulty and quality? This can be viewed from the line graph below:
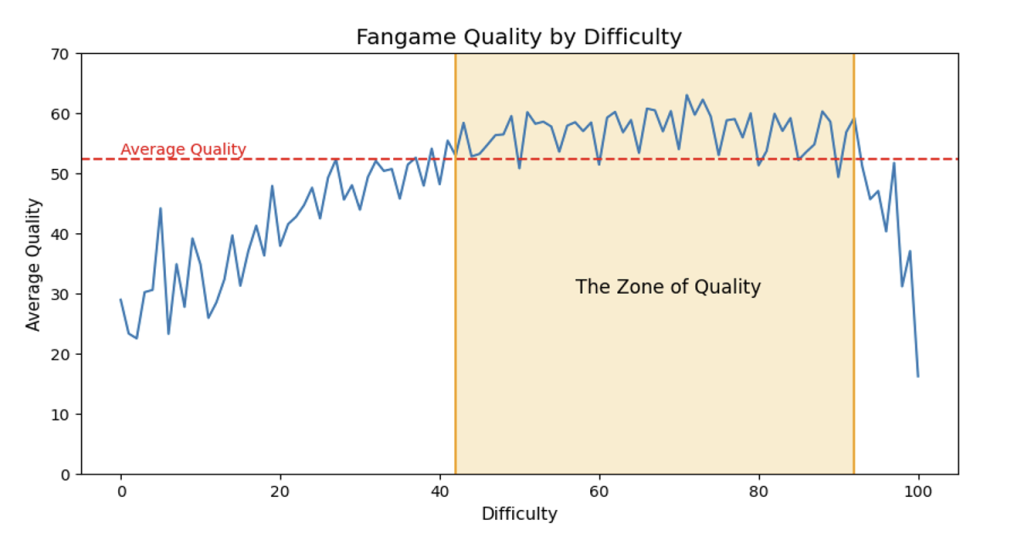
The above graph has two main elements of interest.
Firstly, the trend clearly shows how increasing difficulty is correlated with perceived quality. This point has some nuance to it, as the enduring popularity of fangames lies at least partly in their high difficulties. This difficulty has its origin in the ur-fangame “I Wanna be the Guy”, which was famed for its unconventional gameplay mechanics and counterintuitive design. To give some perspective, I’d argue that any fangame with a difficultly ranking of above 65 is more challenging than what would be considered acceptable for most mainstream games. Therefore, the fact that fangames in this elevated difficulty range are still so highly rated demonstrates how challenging gameplay is inextricably linked to both quality and the underlying identity of the fangame community.
Secondly, the above trend sharply reverses at a difficulty of about 92, plummeting down to extremely low scores as it approaches 100. On a surface level this would suggest that even the fangame community has limits on what is an acceptable difficulty [2], but I prefer an alternative perspective. Balancing game difficulty is an important element of game design; even “difficult” games need to avoid becoming overly frustrating. Therefore, effort put into balancing game difficulty is likely correlated with the effort put into making the game in general, which is itself a strong indicator of overall quality. Thus, games that have extremely low or extremely high difficulties likely point to broader issues with how the game was constructed, which is reflected in the rating that is ultimately given to it.
Genre Popularity
Fangames can be split into a variety of genres based on tags that are assigned to them. Both the creation and application of tags is fully crowd sourced, which is why (as mentioned in Part 2 of this series) there are over thirteen hundred different fangame genres.
Despite the multitudes, only a tiny handful are actually commonly used and assigned to multiple games. This is shown in the below pie chart, which splits the total number of tags ever assigned by genre:
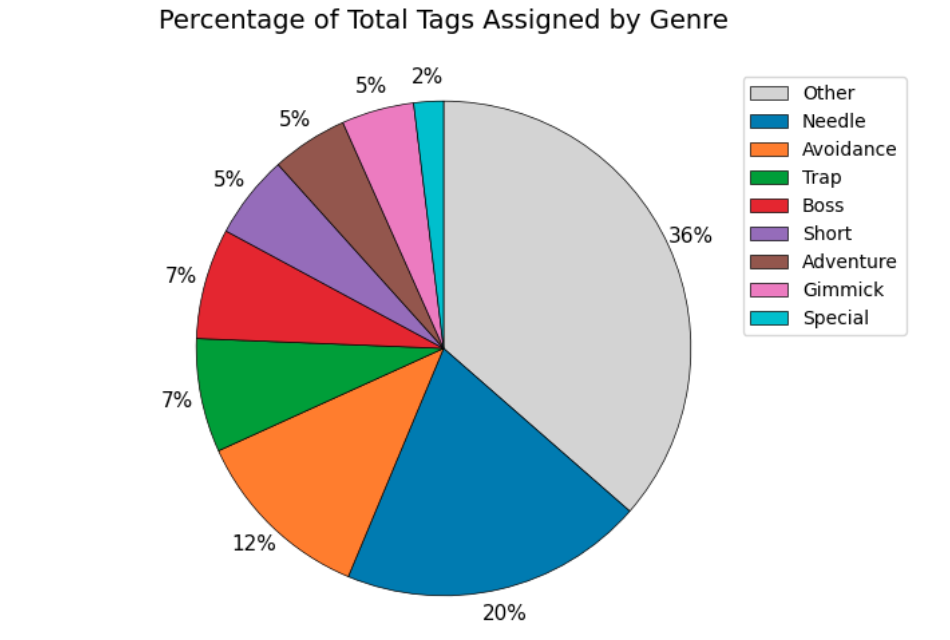
Selecting the top 8 genres shown above and splitting them as a percentage of total fangames per year that were assigned the corresponding tag gives the following:
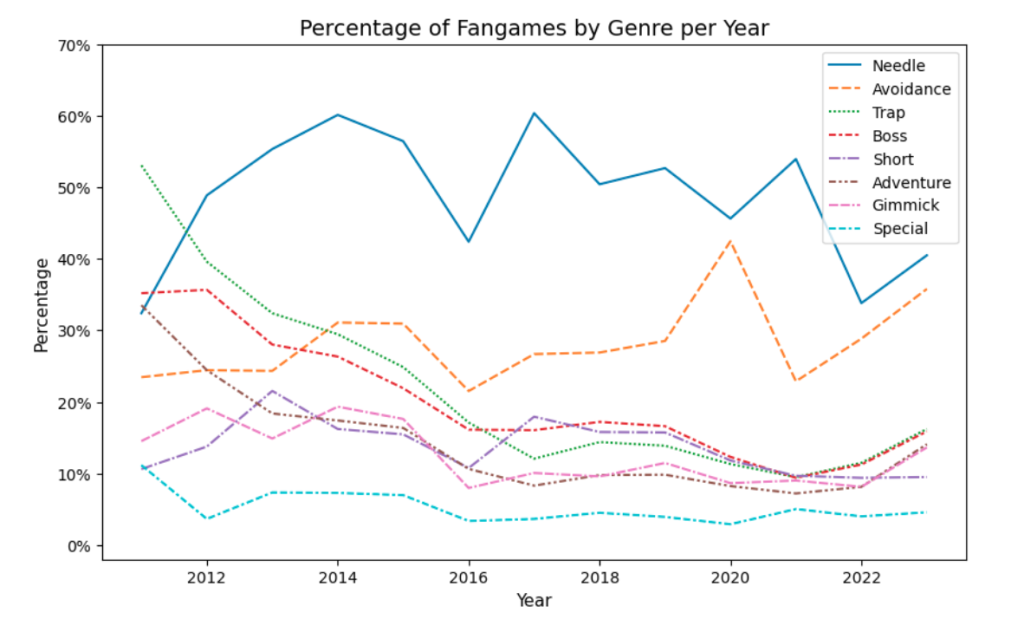
The most interesting take away for me is how the ‘Needle’ genre is so dominant, with around 50% of all games in any given year being assigned that tag. It evokes images of previous periods of excessive genre popularity in media, such as Platformer video games in the 90’s, or Western films in the 50’s.
Reasons for this could be due to different fads and the ease of certain genres to be made over others. Because the genre tagging is crowd sourced, another possibility comes down to just how broadly applicable the tag is. For instance, if one were to have “Human” as a tag for the content of movies, it’s likely that over 95% of films would would meet the criteria!
Information Availability on the Website
As discussed in Part 1 of this series, each web page that hosts a fangame is made up of various attributes, like title and quality rating. Not every attribute is available on every web page, however; some may be absent because they haven’t been added yet, such as images or tags, whereas others likely have been lost over the years, such as download links. The overall attribute availability across all thirteen thousand web pages is as follows:
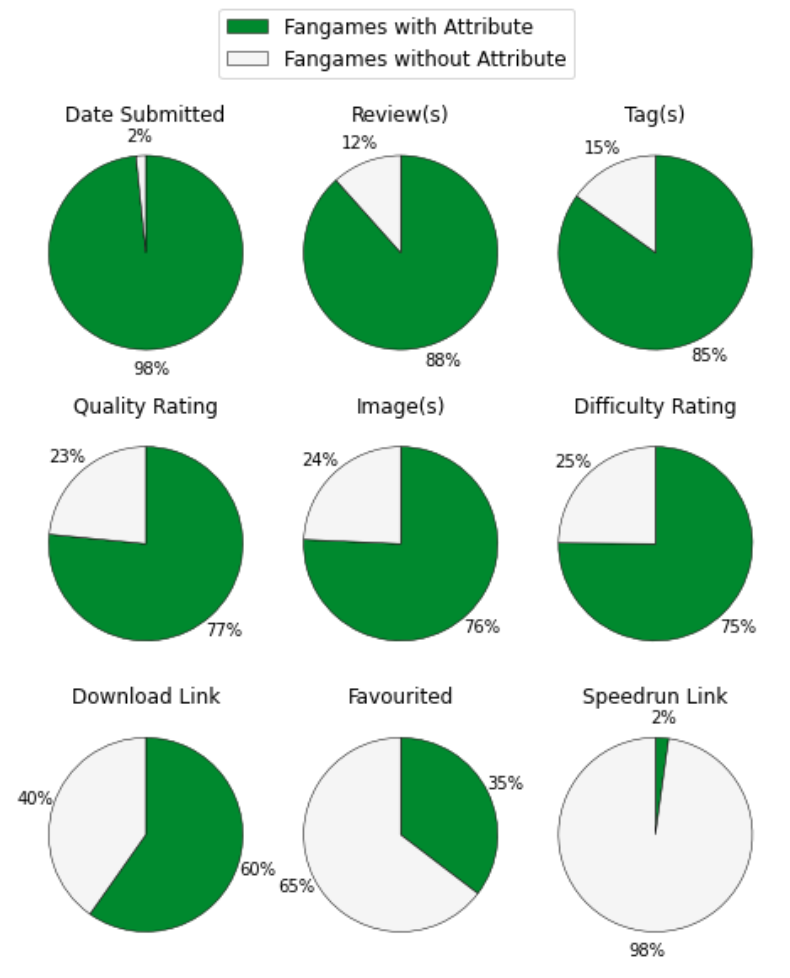
We can see that there are significant gaps in the extent of attribute availability across the website. To try and get a meaningful view of the overall situation, I implemented a classification system that was designed to split all fangames into discrete buckets based on the quality and amount of information available on their respective web page. The most important classification points are:
- Does the web page have a download link? (So that the fangame can be played.)
- Does the web page have attributes that indicate what the fangame is like? (Reviews, images, and tags.)
- Does the web page have a speedrun leaderboard link [3]? (Since this would signal a game that is unlikely to ever be forgotten or lost.)
This results in the following pie chart:
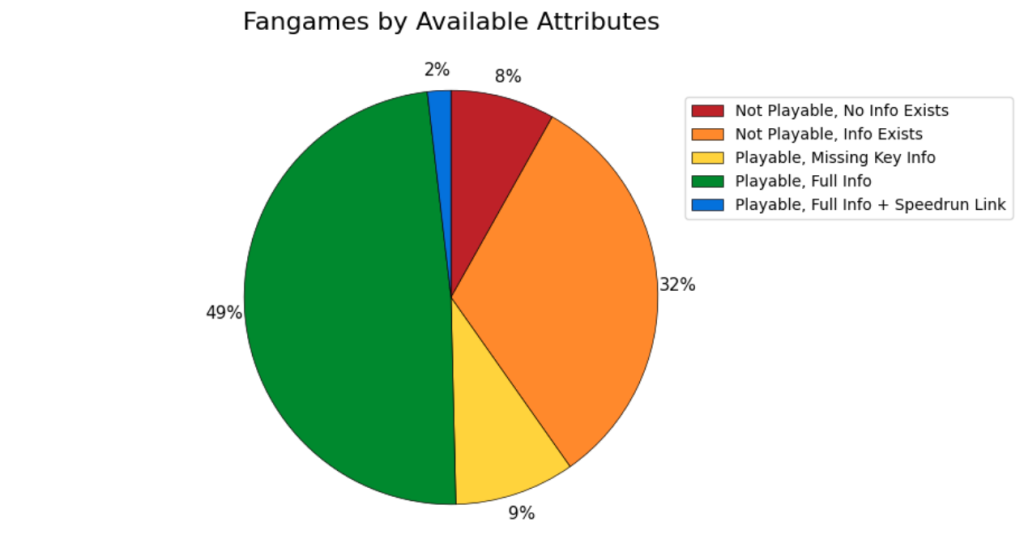
We can see that that a large percentage of fangames aren’t playable, or at least don’t have a direct link on the website from which they can be downloaded [4]. This creates an image of the fangame landscape as being somewhat phantasmal, filled with only traces of data that hint at games now lost, or indeed leaving behind no information at all.
This result points to a larger issue in digital archiving: the loss or absence of important information, whether from entropy or incomplete/unclean data from the outset. As somewhat of an information essentialist, I’m of the opinion that every piece of lost media is tragic in its own right.
Every creative work, regardless of its inherent quality, is an expression of the vision and effort by its creator. We cannot predict who a piece of work will influence, or what ideas and styles may resonate down the line in influencing other creative projects. When information on the work, or the work itself, is lost, we are ultimately losing creative possibilities and small but essential elements in the tapestry of human passion. It’s for this reason in the full report that I encourage more consideration toward leaving information on fangame web pages and maintaining access to the games where possible.
Conclusion
That concludes the series on my data analysis project. It’s been quite an experience, covering as it did the full spectrum of the analysis pipeline (data collection, cleaning, analysis, visualisation and presentation).
Compared to the first report I did several years ago, the growth in my abilities and skillset is very clear. This is particularly evident in how I deployed code to obtain data en masse, and generate reproducible visualisations; a long way from the old days of just using excel!
In terms of impact, the report itself [1] has been shared with the fangaming community, including being posted to the news section of the ‘Delicious Fruit’ website itself, and has set off quite a bit of debate and discussion. It’s a joy to have people engaging with and (hopefully) being inspired by your work, beyond the pleasure that comes from creating the work itself.
This is my second series of online posts made exclusively for my website. My next series will probably lean more into the data engineering/pipeline construction, which I’ve been studying quite a bit recently. In the meantime, I hope you enjoyed these posts, and feel free to drop me a line with additional questions and comments!
[1] Auto-download through clicking on this link here.
[2] For context, one of the most famous fangames with a difficulty of above 90 (“I Wanna Kill The Kamilia 3”) only has a few hours of content, but typically takes several hundred hours to beat due to the absurdly high difficulty.
[3] Speedrunning is essentially trying to complete a game as quickly as possible. It is an extremely popular activity, with many players streaming their runs online. For this reason, a game that has a speedun link likely has a lot of detailed content about it (videos, etc.) that make the chance of it becoming forgotten or lost media unlikely.
[4] Some games that fit into these categories aren’t necessarily lost; they simply might not be publicly available or are hosted on different websites. Although being classified as “Not Playable” doesn’t necessitate that these games are lost media, there is a high likelihood that’s what they are, whether from link rot or the games being taken down by their creator.