
Fangame Analysis Part 2:
Data Cleaning
“Cleanliness is next to godliness.” – John Wesley
Following on from the overview of the data and method of extraction from Part 1, we can now look at the most objectively “fun” and “enjoyable” topic in the data pipeline: cleaning!
I’ll start by discussing what data cleaning is and some methods used for it. If you want to get right into how I cleaned the data for this project, skip to this section here.
What exactly makes Data Clean?
“Clean data” can have many definitions. I would simply describe it as data that exists in a state that is fit for purpose, whether that be analysis, modelling, or viewing. There are various empirical methods to determine how clean any given dataset is, and the level required may differ depending on the use case.
Let’s give an example of what I mean. Consider the following image, which shows the (imaginary) results of a single question survey.
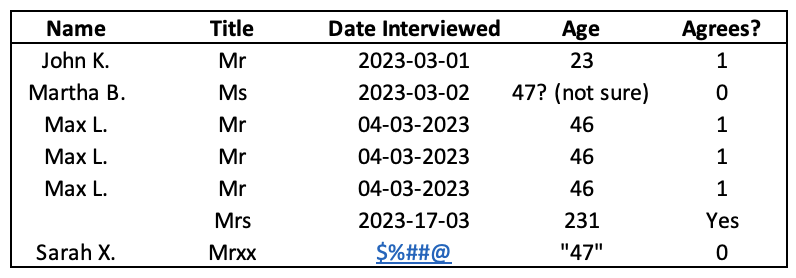
Would we be able to perform a useful analysis on this data? Maybe…but it’d be difficult! Here is a list of issues in the dataset:
- The name of one of the surveyed people is missing.
- There appears to be a triplication of the “Max L.” row.
- Sarah X.’s title has been misspelt.
- There are inconsistent date formats (‘YYYY-MM-DD’ vs ‘DD-MM-YYYY’).
- The date that Sarah X. was interviewed has been corrupted.
- Martha B.’s age is a comment, not a number.
- The missing individual’s age is an outlier.
- Sarah X.’s age is in string (i.e. word) format, not a number.
- The missing individual’s response is given as “Yes” instead of a “1”.
Although the above example is exaggerated, each issue listed is one I’ve encountered in one form or another in my time working with data.
In order to analyse it properly, all of the above problems need to be resolved.
Methods of Data Cleaning
So your data is a mess, congratulations. How can one go about resolving that?
There are many different methods. You could:
- Generate the data in a clean and consistent format at the outset. (Obviously not possible if you’re taking the data from an external source.)
- Manually go through and clean the data. This method is still employed by a surprisingly large number of companies, who typically get contractors to manually input and correct the data as they go. If mind-numbing work is your vibe, there are plenty of opportunities available [1].
- Identify commonalities in how exactly the data is unclean and programatically deploy a solution.
For this project, I obviously went with the second option. Let me now give a painfully meticulous breakdown of how I went through 13,096 rows and 13 columns fixing the data as I went…
Joking, of course! I went with the third option. Note that by “programatic”, I mean developing a consistent method in code that can be tweaked or rerun at will. This not only ensures the output is reproducible, but also means that expanding the dataset isn’t a problem, since you can always rerun the code to clean it again at a later point (assuming that no new issues exist in the new data).
For some types of unclean data, the approach taken to resolve them is obvious. In the prior example, instances of “Yes” in a boolean column can simply be replaced with “1”.
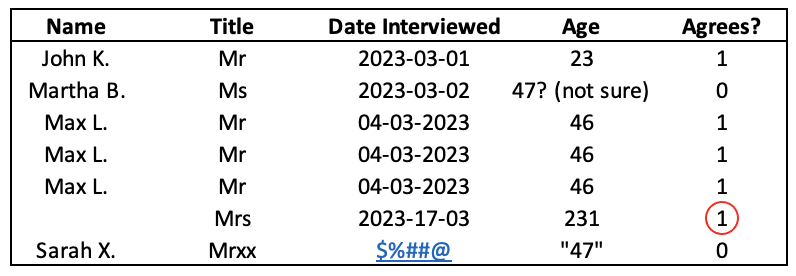
However, things can quickly become more complex. Consider the outlier of the person’s age being written as 231 in the example above.
Do we assume that one of the numbers was added erroneously, so that it’s actually supposed to be 23? Or 31? Or even 21? Do we remove that data point entirely since it could skew the results? Or do we do something more complex, like finding the average of the other ages and substitute that in for the value?
There’s no “correct” solution to such problems. There exist entire books written about the subject of data cleaning [2], and the answer will often depend on what you’re trying to accomplish.
For the next section, I will cover the specifics of what I actually did to clean the dataset for my project.
Cleaning the Data (Basic)
Before beginning the analysis, it was worth putting some thought into questions I wanted to ask and what changes to the data would be needed to answer them effectively.
One of the obvious category of questions ripe for exploration would pivot around the date the games were submitted. Thankfully, the dates retrieved from the dataset were consistent in their formatting, though still in need of cleaning.
Here there are three things that need to be accounted for: removing the “Date Submitted: ” portion of the datum; converting the date into a datetime data type; and dealing with instances where a date doesn’t exist. The method I chose was as follows:
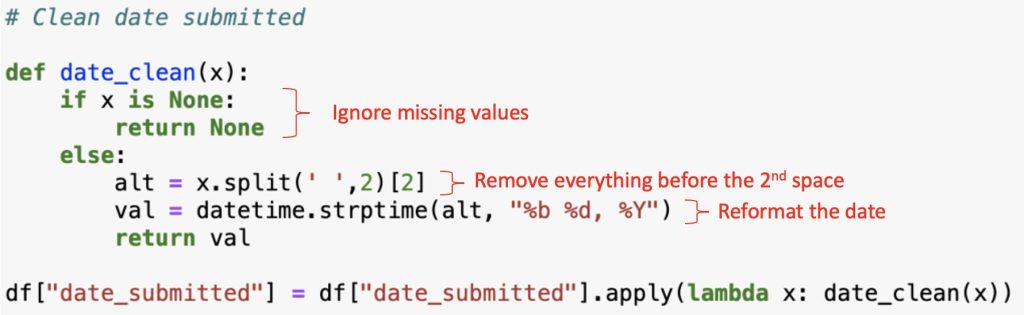
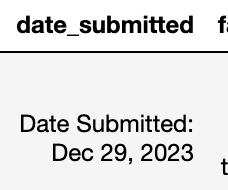
Editing out some portion of the data, like in the above instance, is pretty common in data cleaning. Quite often the information was initially intended for human viewers, who require more context than a machine performing an analysis. Thus you get data like the following:
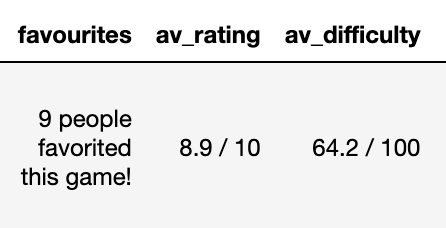
The above can be fixed using code similar to before.
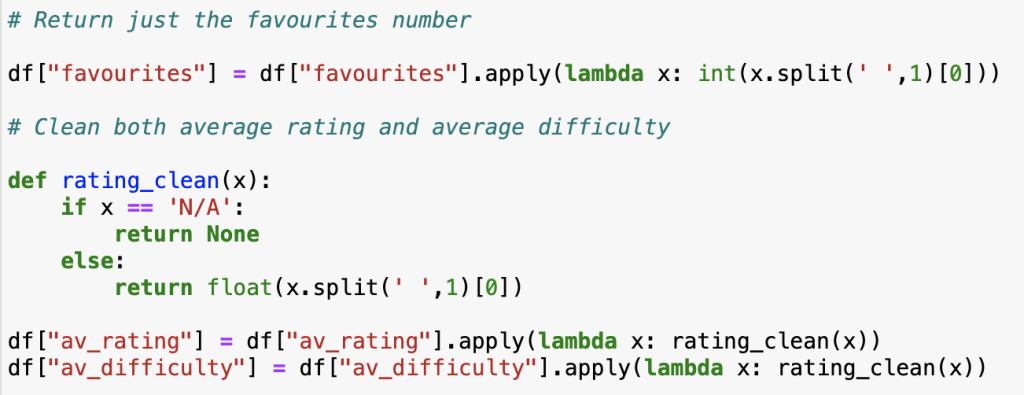
Which returns it in the following format.
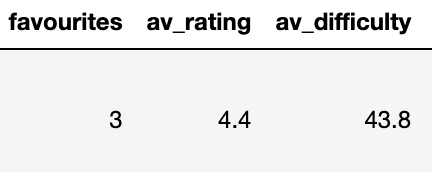
That gives a decent overview of the basic data cleaning that was performed.
Cleaning the Data (Advanced)
By far the most complicated, and therefore most interesting, data cleaning problem I was faced with was regarding tags.
Tags are descriptors chosen and voted by reviewers to categorise the games. Their primary purpose is to facilitate searching for similar genres of games. There is no limit to how many tags a game could be given, nor to what tags can be created and assigned. An example of a typical tagging system for a game is as follows:
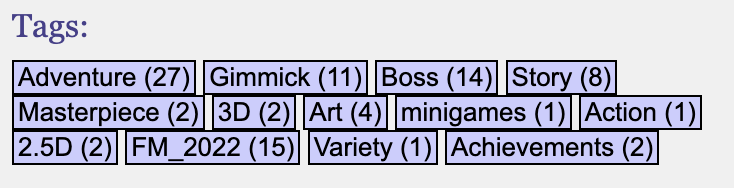
[Adventure (27), Gimmick (11), …, Achievements (2)].
Clearly many interesting questions could be asked using tags, such what genre of game has the highest average rating, which are the most common genres published, etc. But how to wrangle the data into a clean format?
The solution I hit on was to split out each tag category into a separate column. The column would contain either a “1” or “0”, indicating whether the game had been assigned that tag. This would result in a “sparse” dataset where you could determine every game tagged as, for instance, ‘Adventure’ by filtering on every row that has a value of “1” in the ‘Adventure’ tag column.
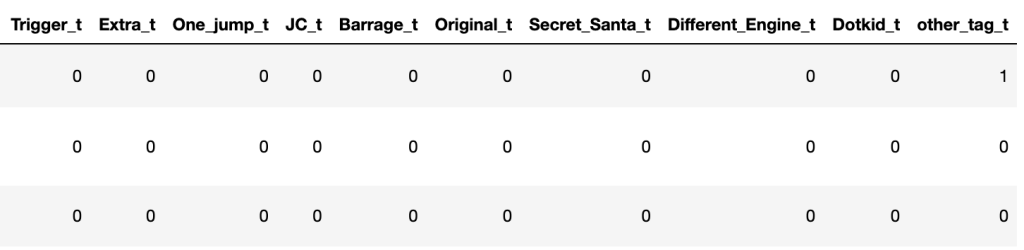
The first problem came from the fact that anyone could generate tag categories, which of course meant that everyone did generate tag categories.
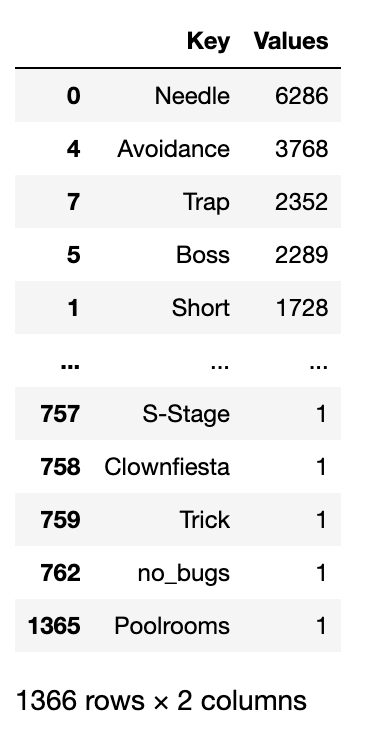
Here, it was worth determining what the distribution of tags assigned was. A pareto chart is a useful visual for that.
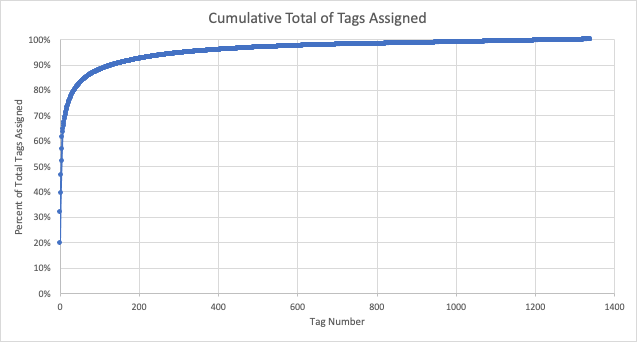
I found that 50% of total tags assigned by reviewers to games came from just 5 categories. Indeed, the top 50 categories made up 82% of tags applied. Given this, and the fact that many of the categories were jokes or misspellings of other ones, I restricted the number of tags split out into columns to the most popular 50, and lumped every other category togethor as “other”.
Performing the above action was a 5 step process and took 80 lines of code. This included dealing with the precisely one category that had a space in it (‘Secret Long’) which caused an error in one of my functions. Such are the joys of data cleaning.
Conclusion
In this article we have reviewed data cleaning and some of the methods used on the fangame dataset. In some instances, cleaning data can be the most complex and time consuming component of the data pipeline. However, the benefits of having clean data make the time investment more than worth it, both in terms of running an effective analysis or model and avoiding spurious conclusions because of faulty data.
Now that we’ve waded through all that, join me in Part 3 as we finally get to the analysis itself, and the interesting results that came out of it!
[1] Jokes aside, I am genuinely interest in the topic of work and job suitability. Although I love being in data, like most people there are at least a dozen careers I would like to have experienced “in an alternative timeline”. (Botanist, salty sea captain, detective, etc.) Manual data entry/cleaning is not one of them, but it’s fascinating to read the perspective of people who are either interested in it, or seem to really enjoy it.
[2] Examples here and here. I can’t attest to the quality of either of these books, but I mention them to show just how deep into the subject one can dive.